Our website is made possible by displaying online advertisements to our visitors.
Please consider supporting us by disabling your ad blocker.
Chart

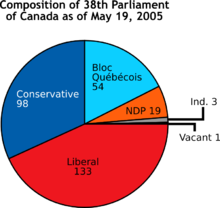
A chart or graph is an image which summarizes data and presents it in an easy to understand way. Charts are often used to make it easier to understand the relationships of different aspects of the data. It is easier to read a chart than the raw data.
Previous Page Next Page


